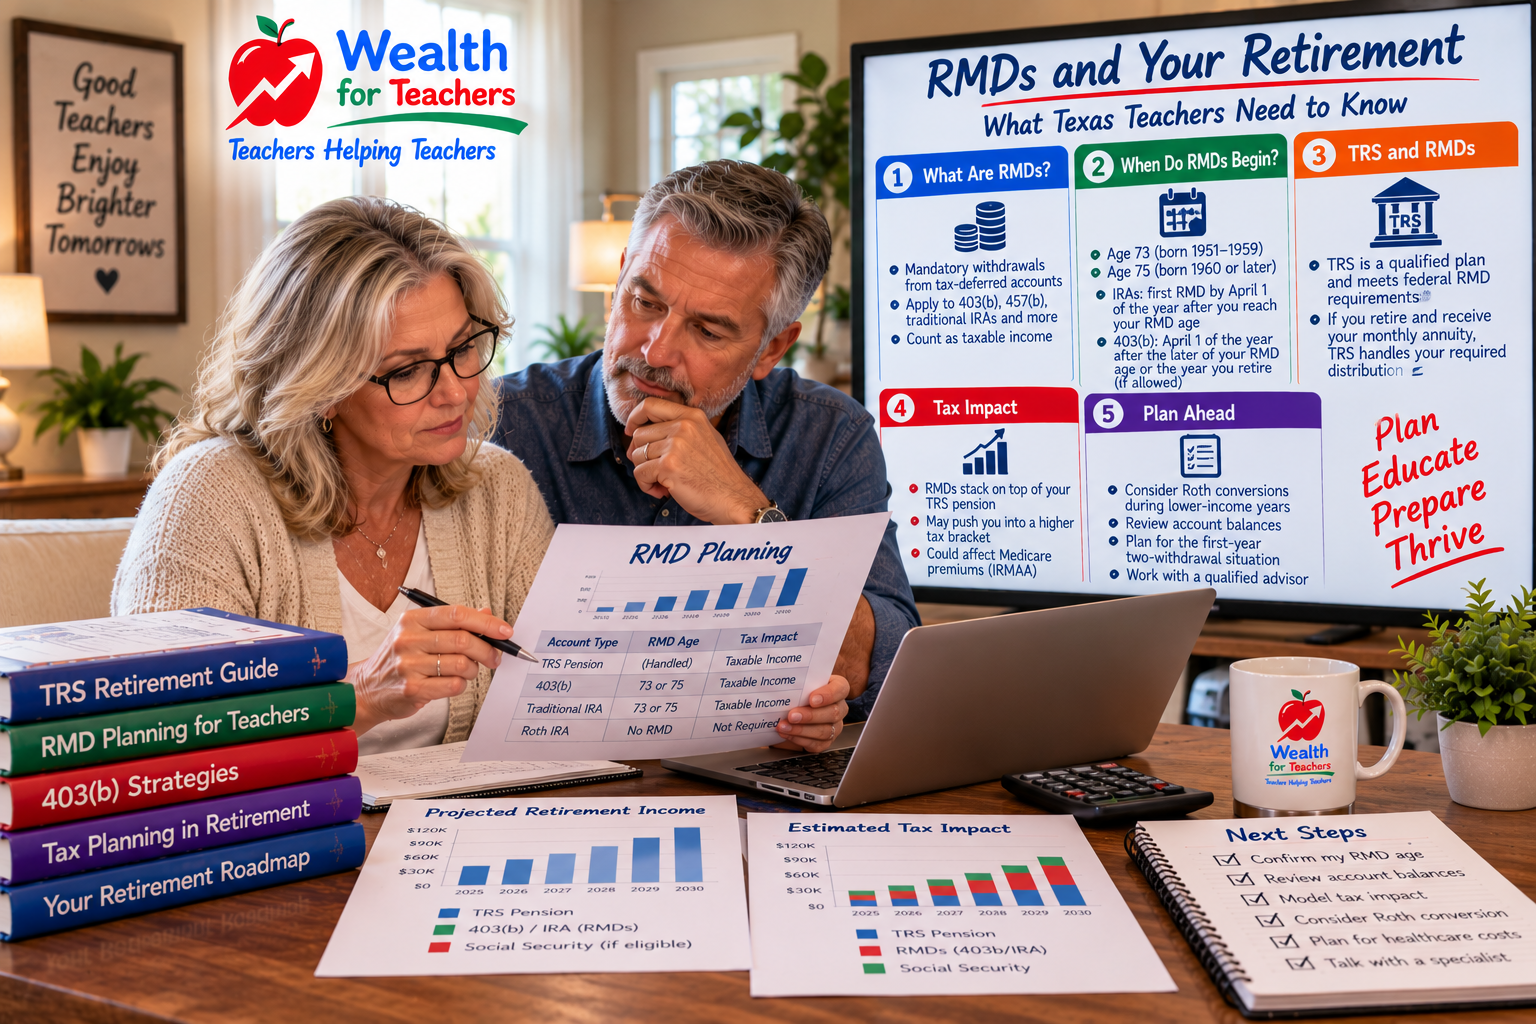
How Required Minimum Distributions Affect Retirement Strategy
Required withdrawals can change your tax and income plan.
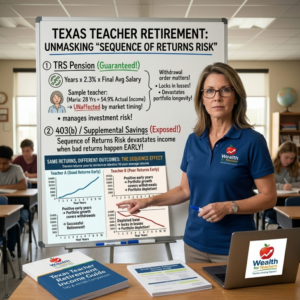
Market timing can impact your retirement income more than you think.
You’ve spent decades building your Texas Teacher Retirement System pension. You’ve calculated your expected monthly payments. You’ve planned your retirement budget around that steady TRS income plus your 403(b) withdrawals.
Texas teachers can also run a full pension estimate using the Texas Teacher Retirement Calculator to better understand their retirement outlook.
But there’s a hidden risk that most teachers never consider: sequence of returns risk teachers face can devastate retirement income, even when your overall investment returns meet expectations over time.
This isn’t about market crashes or poor investment choices. It’s about timing – specifically, the order in which your returns happen during the critical years when you’re transitioning from saving to spending.
Our comprehensive Texas Teacher Retirement Planning Guide covers this and other critical retirement risks that can derail even well-planned teacher retirements.
Most retirement plans look great on paper but crumble when tested against real market conditions and withdrawal patterns. Teachers often discover these gaps only after making irreversible decisions about their TRS benefits and retirement timing.
Sequence of returns risk occurs when poor market performance happens early in retirement, forcing you to withdraw money from investments that have lost value. This locks in losses and reduces the principal available for future growth.
Use the TRS calculator to estimate your pension and identify potential income gaps.
For Texas teachers, this risk primarily affects your supplemental retirement accounts – your 403(b), 457(b), or IRA savings. While your TRS pension provides stable monthly income, most teachers need additional income from these accounts to maintain their pre-retirement lifestyle.
Here’s the critical point: the same average returns over time can produce dramatically different retirement outcomes depending on when the good and bad years occur.
Most retirement calculators assume smooth, average returns every year. They might show you’ll earn 7% annually on your investments, giving you confidence in your retirement plan.
But real markets don’t work this way. You might experience:
These returns average to 1.75% annually – but if you’re withdrawing money during the negative years, your portfolio never recovers.
Texas teachers typically retire with multiple income sources. Understanding how sequence risk impacts each source helps you plan more effectively.
Your TRS pension calculation is straightforward: Years of Service × 0.023 × Final Average Salary. If you have 30 years of service and a final average salary of $65,000, your annual pension equals $44,850.
This income remains stable regardless of market conditions. TRS manages the investment risk, and your monthly payments don’t fluctuate with market performance.
Money in your 403(b), IRA, or other investment accounts faces sequence risk when you begin withdrawals. Poor early returns can devastate these accounts, even if markets recover later.
Many Texas teachers underestimate how much they’ll need from these accounts. Research shows most teachers overestimate their TRS income replacement rate, creating dangerous gaps they must fill with other savings.
Consider two Texas teachers, both retiring with $400,000 in their 403(b) accounts. Both plan to withdraw $20,000 annually (5% initial withdrawal rate). Both experience the exact same returns over 10 years – just in different order.
Teacher A experiences positive returns in the first few years of retirement:
After 10 years with identical average returns, Teacher A has approximately $385,000 remaining.
Teacher B experiences the same returns in reverse order:
After 10 years, Teacher B has approximately $165,000 remaining – $220,000 less than Teacher A.
Same total returns. Same withdrawal amounts. Vastly different outcomes due to sequence risk.
Many Texas teachers assume their TRS pension eliminates retirement income risk. While TRS provides valuable stability, most teachers need additional income sources.
TRS typically replaces 50-70% of your final salary, depending on your years of service. A teacher with 25 years of service earning $60,000 receives an annual TRS pension of $34,500 – leaving a $25,500 annual income gap.
You must fill this gap with other savings, and these accounts face sequence risk.
TRS-Care provides retiree health insurance, but costs can increase significantly over time. Medicare supplements, long-term care, and prescription drugs create additional expenses that your pension alone may not cover.
These rising costs force increased withdrawals from your supplemental accounts, amplifying sequence risk effects.
Sequence risk poses the greatest threat during the first 5-10 years of retirement. This period, often called the “sequence risk zone,” determines whether your retirement plan succeeds or fails.
During early retirement, your portfolio is at its largest size. Poor returns combined with withdrawals create the biggest dollar losses. Later portfolio growth cannot fully compensate for these early setbacks.
Additionally, you have limited ability to adjust course. Unlike during your working years, you cannot easily increase contributions or delay retirement if markets perform poorly.
Markets eventually recover from downturns, but depleted portfolios need larger percentage gains to return to previous levels. If your portfolio drops from $400,000 to $200,000, you need a 100% gain just to break even.
Meanwhile, you continue taking withdrawals, making recovery even more difficult.
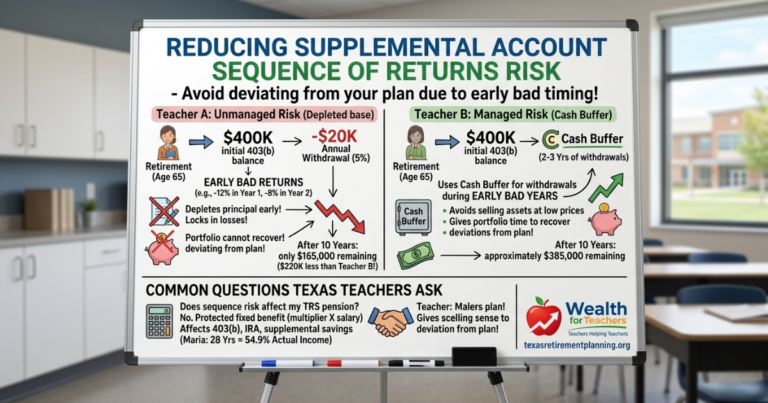
No. Your TRS pension amount is fixed based on your years of service and salary history. Market performance doesn’t change your monthly TRS payments. However, sequence risk affects your supplemental savings that you’ll likely need for full retirement income.
Market timing is impossible to predict consistently. Instead of trying to time markets, focus on building flexibility into your retirement plan through diversified income sources and properly coordinated TRS, IRA, and 403(b) strategies.
The answer depends on your expected expenses, TRS income replacement rate, and risk tolerance. Many teachers need 15-25% of their salary from supplemental sources, but individual situations vary significantly.
TRS doesn’t offer this option, but you can purchase annuities with your 403(b) or IRA funds. This can provide additional guaranteed income to reduce reliance on market-dependent withdrawals.
Traditional 4% rules don’t account for sequence risk. Many experts now recommend starting with 3-3.5% withdrawal rates, with built-in flexibility to adjust based on market performance and spending needs.
Protecting against sequence risk requires strategies that go beyond traditional retirement planning advice.
Maintain 2-3 years of expenses in cash or short-term bonds. This buffer lets you avoid selling investments during market downturns, giving your portfolio time to recover.
For a teacher needing $25,000 annually from supplemental savings, this means keeping $50,000-$75,000
Use the TRS calculator to estimate your pension and identify potential income gaps.